
On This Page8 sections
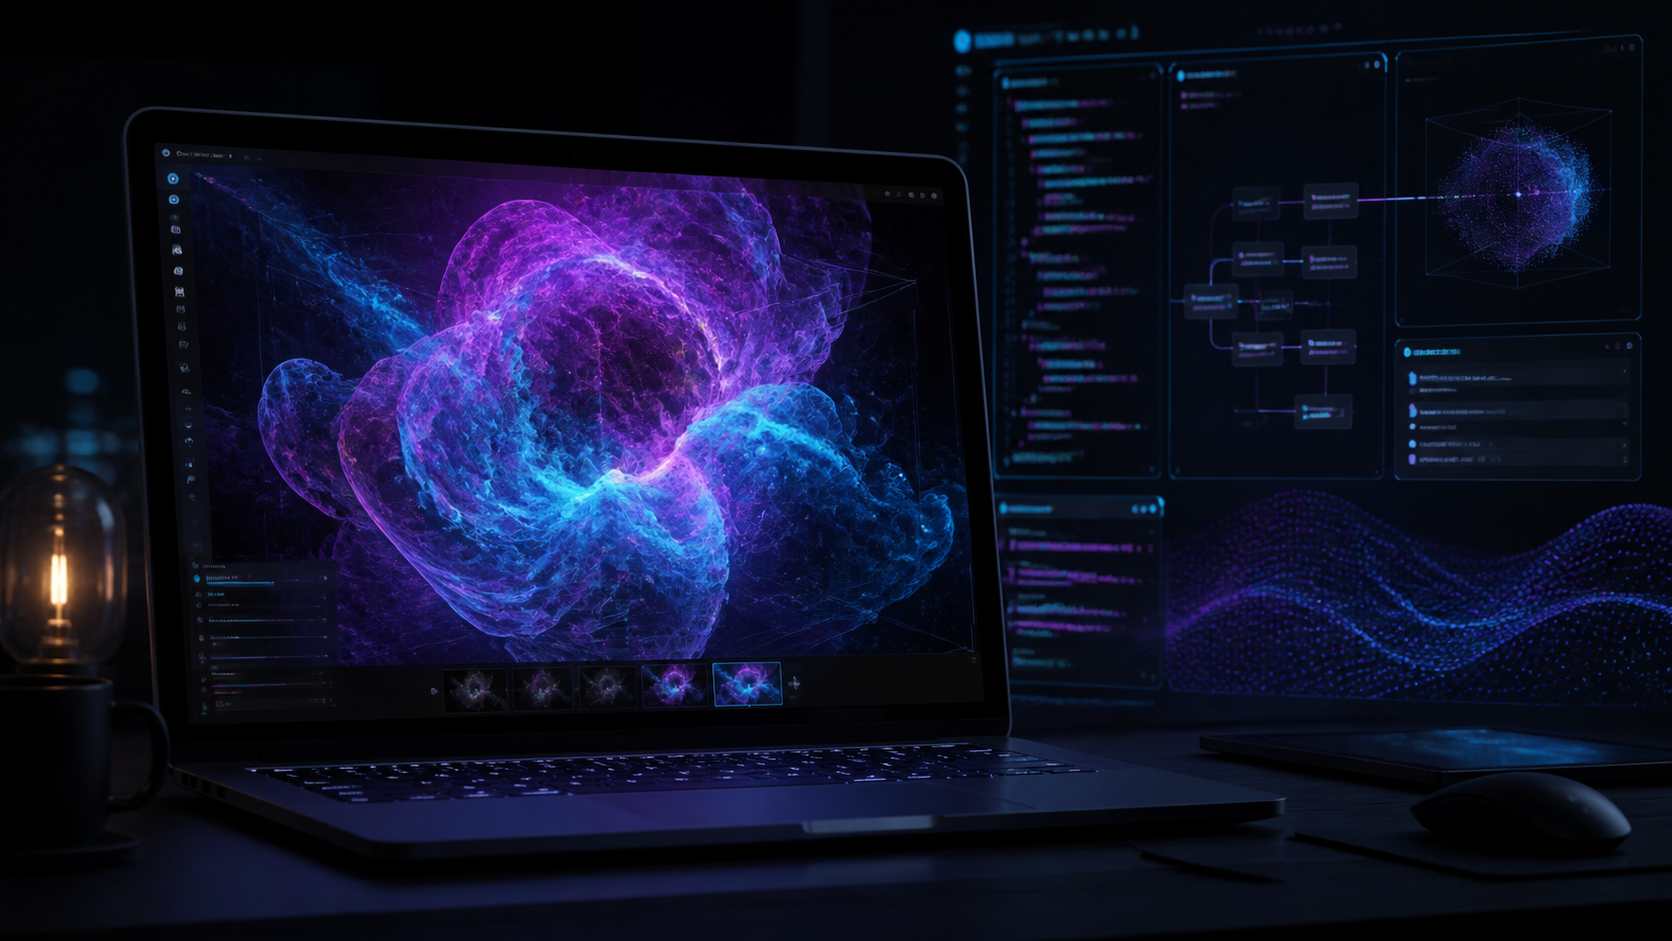
A volume shader test looks like a glowing piece of browser art, but the animation is doing real work. Every frame asks the graphics processor to evaluate a mathematically defined three-dimensional scene, trace many sample points through it, shade the result, and repeat the process fast enough to remain interactive.
That makes the test useful for two reasons. First, it gives people an immediate way to observe how a browser and GPU handle a demanding fragment-shader workload. Second, it has become a good example of a broader software trend: AI IDEs and coding agents have made it much easier for independent developers to turn a narrow technical idea into a polished public tool.
The growing number of volume shader benchmark sites is therefore not just a story about one visual effect. It is also a story about how software is being created in the AI-assisted development era.
What is a volume shader test?
A volume shader test is a browser-based graphics workload that renders a volumetric or mathematically defined 3D scene in real time. Instead of loading a conventional model made from triangles, the shader can describe the scene with formulas such as signed distance fields and calculate the visible result one pixel at a time.
The browser sends this work through WebGL to the device's graphics stack. The test then reports practical rendering signals such as frames per second, frame time, low-frame-rate behavior, and stability during a sustained run.
In plain language, it asks:
How smoothly can this browser, operating system, driver, and GPU render this particular shader workload under the current conditions?
That wording is important. A volume shader test is not a universal ranking of every capability inside a graphics processor. It is one focused workload running through a specific browser graphics path.
How raymarching creates the scene
Traditional real-time 3D graphics usually begin with geometry: vertices are assembled into triangles, transformed into position, and rasterized into pixels. Raymarching starts from a different direction.
For each pixel, the fragment shader sends an imaginary ray from the camera into the scene. It samples the mathematical field repeatedly, advances through empty space, and stops when it reaches a surface or exits the test volume. The shader then estimates lighting, color, depth, and other visual properties.
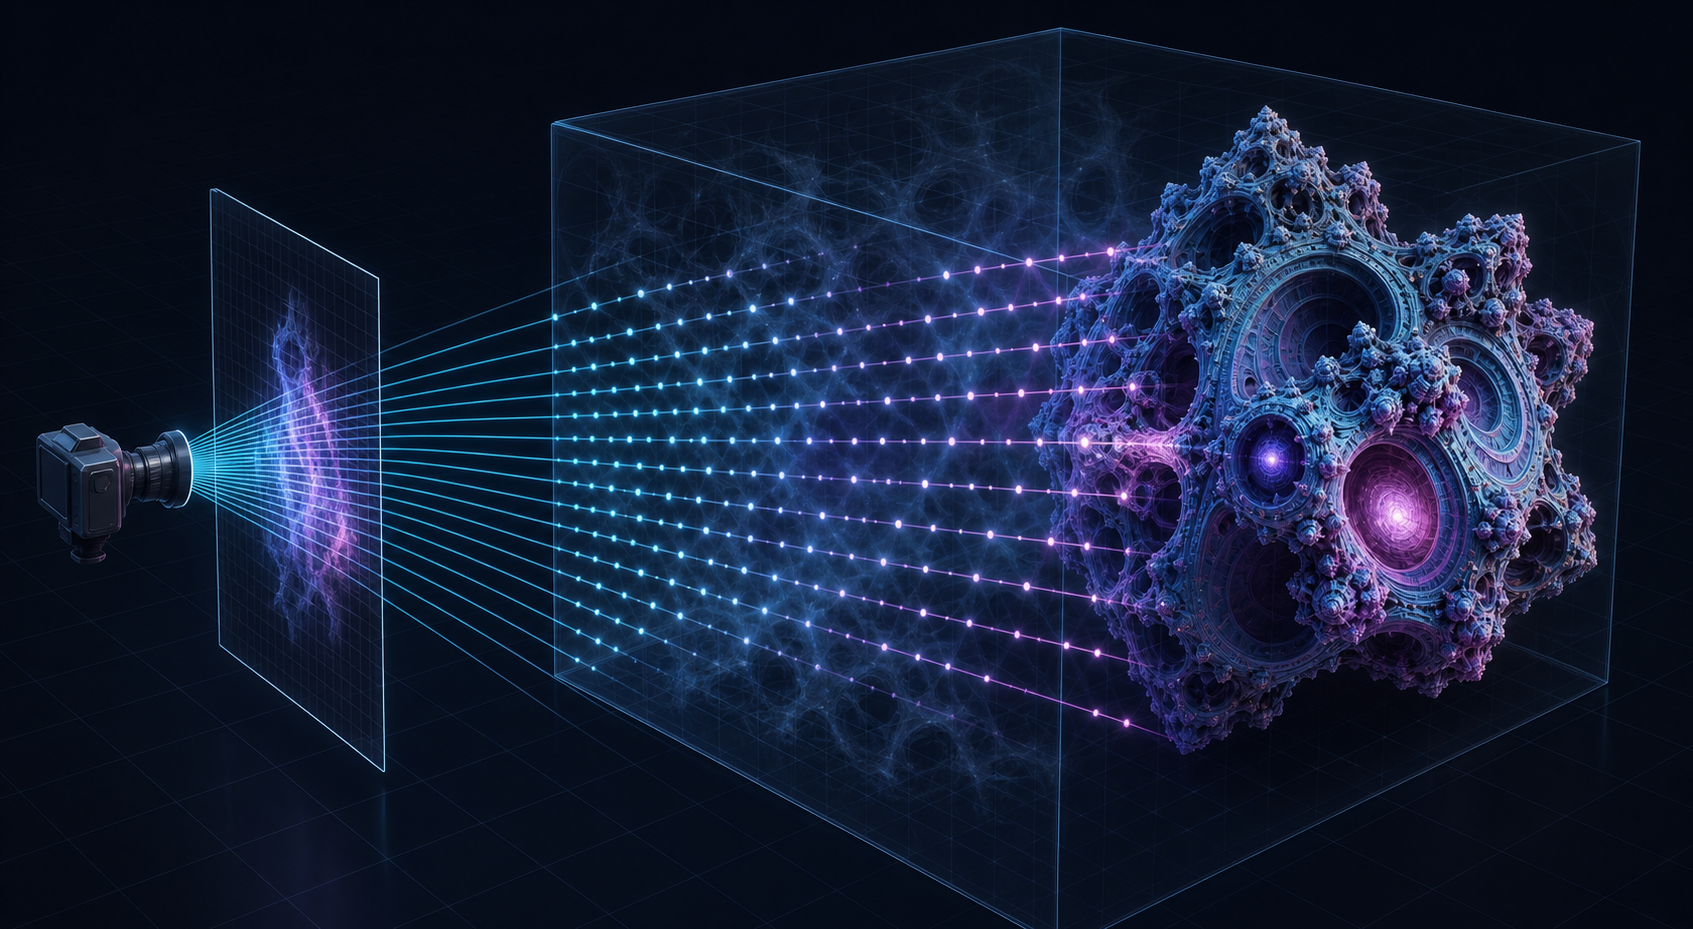
The cost grows quickly because the process can involve:
- Millions of pixels per frame.
- Many ray steps for every pixel.
- Repeated distance, angle, power, and lighting calculations.
- Higher solver accuracy near complex surfaces.
- Dozens of complete frames every second.
Increasing the rendering resolution, ray-step count, or solver accuracy gives the GPU more work. That is why a visually simple full-screen shader can place a surprisingly heavy load on a laptop, phone, or desktop graphics card.
What does a volume shader test measure?
The most useful way to understand the result is to separate what the workload can reveal from what it cannot.
| It can provide clues about | It does not directly measure |
|---|---|
| Fragment-shader arithmetic performance | Overall gaming performance |
| Browser GPU acceleration | AI model inference speed |
| WebGL driver and browser behavior | CPU-only application performance |
| Sustained FPS under one shader workload | Video encoding or decoding throughput |
| Frame-time consistency and visible stutter | Every feature of a native graphics API |
| Possible thermal throttling during repeated runs | The GPU's complete theoretical capability |
The whole software stack matters. Two browsers on the same machine may produce different results because their rendering paths, driver interactions, power policies, and background workloads are not identical. A laptop may also switch between integrated and dedicated graphics without making that decision obvious to the user.
For this reason, the result is best treated as a controlled observation rather than an absolute hardware verdict.
FPS, frame time, and stability
Frames per second is the easiest number to recognize, but it is not the only useful signal.
Average FPS
Average FPS describes how many frames the browser completed per second across the measured interval. Higher is smoother when the engine, mode, resolution, browser, and test duration are otherwise equal.
Frame time
Frame time measures how long one frame takes to render. At 60 FPS, a frame has roughly 16.7 milliseconds available. A stable 30 FPS corresponds to about 33.3 milliseconds per frame. Large frame-time spikes can reveal interruptions that an average FPS number hides.
Low-FPS behavior
A low-frame-rate floor helps show whether the experience remained steady. Two devices can report a similar average while one delivers consistent frames and the other alternates between fast frames and severe stalls.
Stability over time
A short burst can look impressive before heat and power limits take effect. A longer run may show the performance falling as a fanless laptop or phone warms up. That is not necessarily a defect in the benchmark; it may be the most informative part of the result.
Why are there so many volume shader test products?
Search for this idea today and the result page can feel unusually crowded. Several products may appear to solve the same simple need: open a page, render a fractal-like volume, and display an FPS number.
The underlying reason is not that every implementation is identical. It is that the cost of building a focused web tool has fallen dramatically.
Before AI-assisted development, a solo creator needed to assemble several distinct skills:
- Understand or adapt GLSL shader code.
- Create and recover a WebGL rendering context.
- Build a responsive interface for desktop and mobile.
- Measure animation timing without distorting the workload.
- Detect browser and hardware information carefully.
- Store or compare results.
- Write methodology, privacy, and interpretation pages.
- Test failure modes across browsers and devices.
That is still real engineering work. The difference is that an AI IDE can now help one person move across those layers without stopping to search for every API detail, boilerplate pattern, or unfamiliar error message.
The result is a wave of small, specialized products. The same pattern appears in image utilities, file converters, calculators, code visualizers, device tests, data-cleaning tools, and prompt-to-app experiments. One clear need can support many implementations because creators can prototype different interfaces, scoring systems, modes, and explanations in days rather than months.
How AI IDEs change the development loop
AI IDEs do more than autocomplete a line of code. Modern products can inspect a repository, edit multiple files, run commands, read errors, test a change, and iterate on the result.
For a graphics benchmark, tools such as Cursor, Claude Code, Codex CLI, and Windsurf can help with practical tasks around the shader:
- Scaffold the application shell and responsive controls.
- Explain shader compilation and linking errors.
- Add WebGL 1.0 or WebGL 2.0 compatibility checks.
- Build benchmark presets and custom configuration panels.
- Record FPS, frame time, and stability samples.
- Create result tables and downloadable reports.
- Add accessibility, metadata, analytics, and localization.
- Write tests for the non-graphics parts of the application.
Prompt-to-app tools such as v0 and Lovable reduce the effort required to explore alternative interfaces. A developer can generate a control panel, revise the information hierarchy, and connect the interface to an existing rendering engine without hand-writing every component.
This does not mean AI automatically creates a trustworthy benchmark. It changes where the difficult work sits.
Generating code is becoming cheaper. Defining a fair workload, keeping engine versions separate, controlling variables, validating measurements, documenting limitations, and resisting misleading claims remain human responsibilities.
Similar demand does not guarantee similar results
When many developers build around the same concept, small implementation choices become important.
One site may render with WebGL 1.0 while another defaults to WebGL 2.0. One may use 600 ray steps for a medium test while another uses a different scene, solver, or resolution. One may calculate a score from average FPS alone, while another includes a normalized workload multiplier. Some tools resize the canvas to the physical pixel density of the display; others use a smaller internal buffer and upscale it.
These differences mean that scores from unrelated implementations should not be placed in the same ranking just because their animations look similar.
A fair comparison requires the same:
- Benchmark implementation and engine version.
- Test mode and shader configuration.
- Rendering resolution and device orientation.
- Browser version and hardware-acceleration state.
- Power mode and graphics-adapter selection.
- Test duration and approximate device temperature.
The more polished a benchmark becomes, the more clearly it should expose these conditions.
A practical browser example
If you want to see the workload instead of only reading about it, you can run the Volume Shader Test directly in a compatible browser. It uses WebGL 2.0 raymarching by default and provides Light, Medium, Heavy, Extreme, and custom configurations, along with FPS, frame-time, and stability context.
The useful part is not simply obtaining the largest number. Start with a mode your device can sustain, observe how the result changes over time, and compare only runs made under matching conditions.
How to run a fair test
Use a short, repeatable procedure if you want results that mean more than a quick screenshot.
- Connect the device to power. Battery-saving policies can reduce GPU frequency.
- Close heavy background tabs and applications. Video, games, and other animated pages compete for graphics resources.
- Confirm hardware acceleration is enabled. A software-rendered or fallback path is not comparable with a normal GPU-accelerated run.
- Let the device reach a normal idle temperature. A result taken immediately after gaming or charging may begin under thermal limits.
- Start with Light or Medium. Move upward only after the browser remains responsive.
- Keep the browser window and display conditions consistent. Resolution and pixel density can substantially change per-frame work.
- Run the same mode more than once. The first run may include shader compilation, caching, or other startup effects.
- Record the full context. Device, browser, engine, mode, resolution, duration, and power state belong beside the score.
- Allow cooling time between sustained runs. This is especially important on phones and fanless laptops.
Stop the test if the device becomes unusually hot, unstable, or unresponsive. A stress workload is supposed to be demanding, but no browser score is worth risking the device or losing unsaved work.
What makes a trustworthy volume shader test?
A strong tool should do more than animate an attractive object. Look for these qualities:
Clear methodology
The site should explain the engine, scene, modes, workload variables, timing method, and score calculation in understandable language.
Comparable versioning
If the shader or rendering engine changes, historical results should be labeled accordingly. A new engine can be useful without pretending its scores are interchangeable with an older one.
Multiple performance signals
Average FPS alone is easy to market. Frame-time consistency, low-FPS behavior, test duration, and stability provide a more honest picture.
Local-first behavior
A browser benchmark can perform its rendering and timing locally. If results are uploaded, submission should be explicit and the privacy behavior should be clear.
Conservative claims
The test should describe its actual workload. It should not imply that one shader score predicts every game, creative application, AI workload, or native benchmark.
Useful failure handling
Unsupported WebGL versions, context loss, background-tab throttling, low frame rates, and mobile heat are normal conditions that a mature product should explain gracefully.
Frequently asked questions
Is a volume shader test a GPU or CPU test?
It is primarily a GPU-oriented graphics test because the fragment shader performs the main rendering workload. The CPU, browser, operating system, and driver still influence the result, so it is not a perfectly isolated measurement of GPU silicon.
Why does the test make my phone hot?
The shader repeatedly performs a large number of calculations for every frame and pixel. Sustained work increases power consumption and heat. Phones can lower their performance as temperature rises, which may appear as declining FPS or less stable frame times.
Why do two volume shader sites give different scores?
They may use different shaders, engines, ray-step counts, solver settings, resolutions, timing methods, or score formulas. Compare numbers only within the same benchmark version and configuration.
Is 60 FPS always a good result?
It indicates smooth rendering for that workload, but it is meaningful only with the test mode and conditions attached. Sixty FPS in a light mode is not equivalent to 60 FPS in an extreme mode.
Can an AI IDE build a benchmark automatically?
An AI IDE can generate much of the interface, integration code, charts, and tests. It can also help explain shader errors. It cannot independently prove that the methodology is fair or that results from different devices are scientifically comparable. Those decisions require validation and documented assumptions.
Does the test upload my data?
That depends on the product. Rendering can happen entirely in the browser, while leaderboards or public result tables require some form of submission. Check whether sharing is optional and what device information is stored.
The larger lesson for AI-assisted software
The volume shader test boom is a compact picture of modern software creation. AI IDEs have lowered the cost of turning a technical curiosity into a complete product, so multiple developers can pursue the same demand with different priorities.
That abundance is useful when it produces clearer methodology, better mobile support, safer defaults, more transparent results, and more thoughtful explanations. It becomes noise when products copy an effect but remove the context needed to understand it.
For users, the right response is not to search for one universal score. Choose a transparent implementation, control the test conditions, and treat the result as evidence about one browser graphics workload.
For developers, the lesson is equally practical: AI can accelerate the path from shader experiment to public tool, but credibility still comes from measurement design, testing, documentation, and restraint.
Continue Reading
More articles connected to the same themes, protocols, and tools.


Referenced Tools
Browse entries that are adjacent to the topics covered in this article.