
On This Page8 sections
Key Takeaways
- RateMySite.io is a website intelligence and audit tool that turns technical website checks into simpler grades, recommendations, mobile-versus-desktop comparisons, shareable reports, and public benchmarks.
- Its strongest value is interpretation rather than creating an entirely new measurement engine. Performance analysis is built around Google PageSpeed Insights and Lighthouse data.
- The underlying metrics matter more than the final letter grade. Pay particular attention to LCP, CLS, INP context, TBT, FCP, Speed Index, SEO checks, accessibility, and Best Practices.
- RateMySite is not a replacement for Google Search Console, a complete technical SEO crawler, professional accessibility testing, conversion research, security auditing, or real-user monitoring.
- Search results can be confusing because older products using the RateMySite name focused more heavily on AI-generated design and UX feedback. The current RateMySite.io product is positioned primarily around website performance, SEO, accessibility, technical health, visibility, and benchmarking.
- RateMySite can be especially useful for founders, marketers, designers, agencies, and developers who want a fast answer to the question: What is technically holding this website back?
What Is RateMySite?
RateMySite is a browser-based website auditing service designed to make technical website analysis easier to understand.
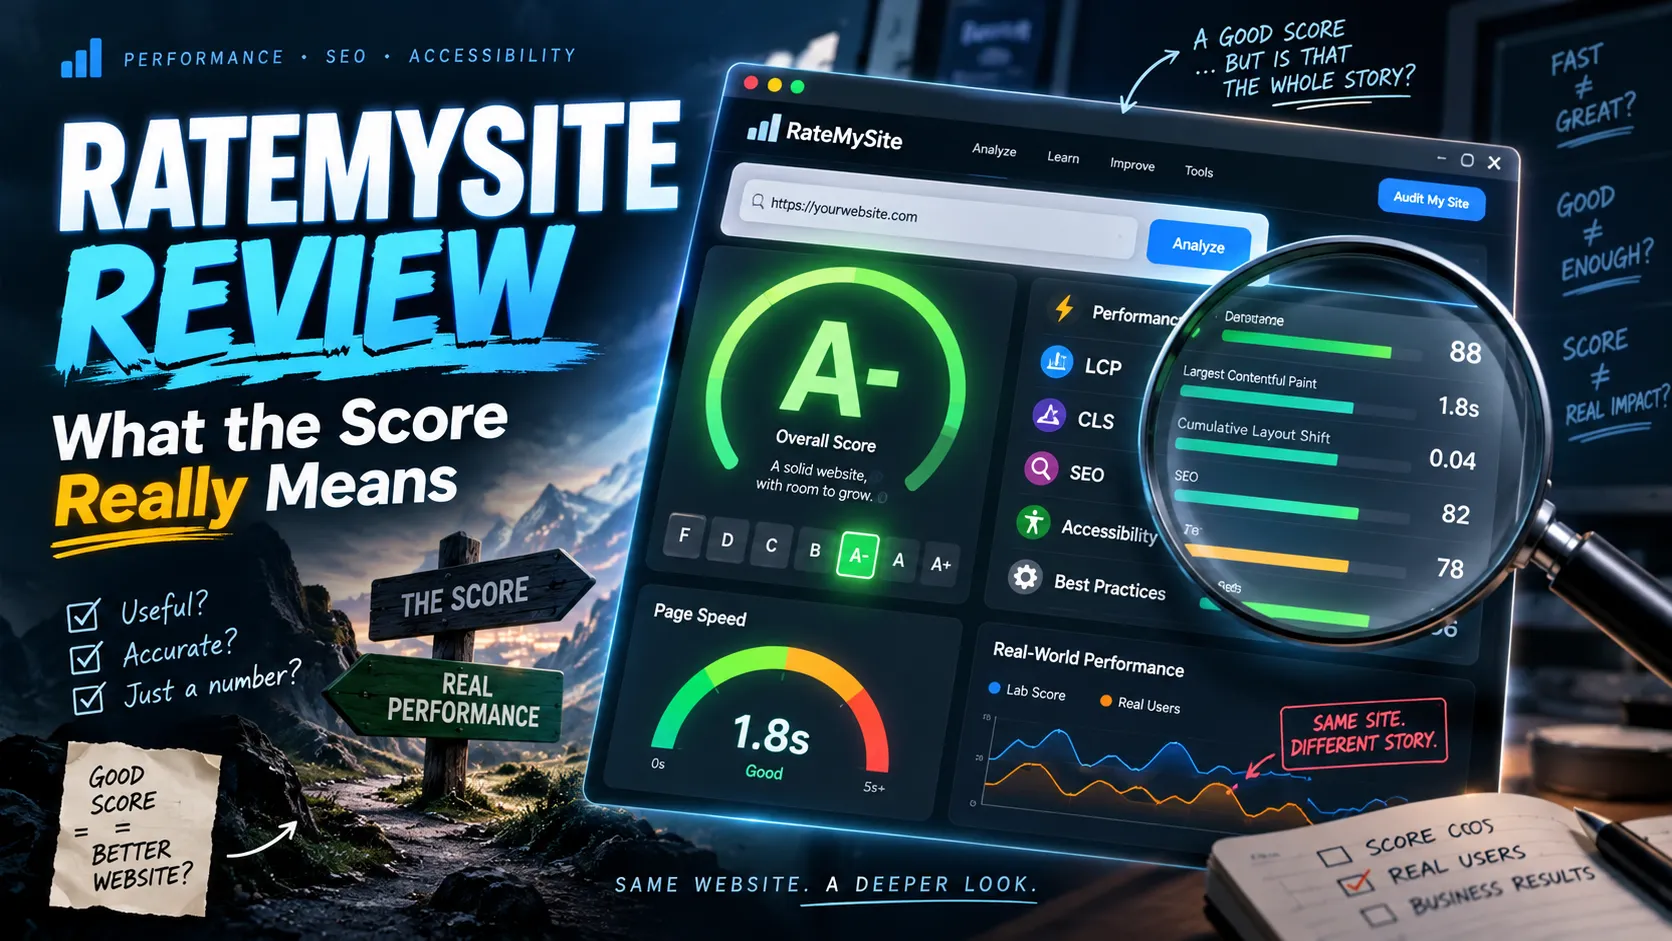
Instead of presenting users with only raw Lighthouse metrics, RateMySite packages website-quality signals into a simpler report that can include an overall grade, individual category scores, performance metrics, recommendations, mobile and desktop comparisons, shareable results, and competitive rankings.
The basic workflow is straightforward:
- Enter a public website URL.
- Run the audit.
- Review the overall grade and category scores.
- Identify the metrics causing the biggest problems.
- Fix the highest-impact issues.
- Run the test again and compare the results.
This makes RateMySite useful as a diagnostic starting point. It reduces the amount of technical knowledge required to recognize that a website has a performance, SEO, accessibility, or implementation problem.
However, the simplicity of the grade can also create misunderstanding. A website is too complex to be accurately described by one letter alone. The grade is best treated as a summary layer, while the underlying measurements should determine what actually needs to be fixed.
RateMySite.io vs Older RateMySite Products
The term ratemysite has been used by more than one website-related product, which can make search results misleading.
Older listings for domains such as ratemysite.app and ratemysite.xyz described a product centered around AI-generated website design, copy, and UX feedback. Some versions emphasized simulated users, design scoring, community-style feedback, and leaderboards.
The current RateMySite.io product has a different emphasis. Its positioning focuses more heavily on:
- Website performance
- Lighthouse audits
- Technical SEO
- Accessibility
- Best Practices
- Core Web Vitals-related diagnostics
- Mobile and desktop comparisons
- Website rankings
- Shareable audit reports
- Traffic and visibility signals
This distinction matters because an older review describing RateMySite as primarily an AI design critic may not accurately represent the current RateMySite.io experience.
How RateMySite Works
RateMySite's auditing workflow can be understood as three layers: measurement, interpretation, and benchmarking.
Measurement
For performance analysis, RateMySite relies heavily on established Google website-quality infrastructure such as Lighthouse and PageSpeed Insights.
Typical measurements include:
- Performance
- SEO
- Accessibility
- Best Practices
- Largest Contentful Paint
- Cumulative Layout Shift
- First Contentful Paint
- Speed Index
- Total Blocking Time
- Mobile performance
- Desktop performance
These metrics describe different parts of the page-loading and rendering experience.
Interpretation
Raw Lighthouse output can be difficult for non-developers to interpret. RateMySite adds value by translating technical results into simpler grades and recommended actions.
For example, a developer may immediately understand that a poor Largest Contentful Paint result can be caused by an oversized hero image, slow server response, render-blocking CSS, or a delayed resource request.
A founder or marketer may simply need to know that the main content is appearing too slowly and which fixes deserve attention first.
This translation layer is one of RateMySite's most practical advantages.
Benchmarking
RateMySite also adds a competitive and social layer through public rankings, shareable reports, and reusable audit URLs.
That creates use cases beyond debugging. A report can be used for:
- Before-and-after optimization comparisons
- Client reports
- Competitor benchmarking
- Product launch checks
- Agency audits
- Portfolio evidence
- Website improvement challenges
What Does RateMySite Measure?
Performance
Performance is one of the most useful sections because it is connected to measurable browser behavior.
Lighthouse's Performance score is calculated using multiple weighted metrics rather than a subjective judgment about whether a website feels fast.
Important metrics include:
- LCP: how quickly the primary visible content finishes rendering.
- CLS: how much visible content unexpectedly moves while the page loads.
- TBT: how long the main thread is blocked by long tasks during a Lighthouse laboratory test.
- FCP: when the browser first displays visible content.
- Speed Index: how quickly the visible portion of the page becomes populated.
It is important to distinguish these from the official Core Web Vitals.
LCP, CLS, and INP are Core Web Vitals.
TBT, FCP, and Speed Index are useful performance metrics, but they are not themselves Core Web Vitals.
This distinction matters because TBT is often used as a useful laboratory indicator of JavaScript blocking, while INP measures actual interaction responsiveness in field data.
Understanding Lab Data vs Real-User Data
One of the most important concepts when interpreting RateMySite or Lighthouse results is the difference between lab data and field data.
Lab data is produced by running a controlled synthetic test. This makes it excellent for debugging because the environment can be standardized.
Field data comes from actual users visiting a website under different real-world conditions.
Those users may have:
- Different phones
- Different CPUs
- Different network speeds
- Different browsers
- Different geographic locations
- Different CDN routes
- Different cache states
A Lighthouse score can therefore improve significantly without guaranteeing that every real user experiences the same improvement.
The strongest workflow is to use synthetic audits for debugging and real-user data for validation.
SEO Analysis
RateMySite's SEO section can identify technical issues that may interfere with search engines understanding or accessing a page.
Potential checks include:
- Page titles
- Meta descriptions
- Crawlability
- Image alternative text
- Link descriptions
- Mobile configuration
- Language attributes
- Selected structured-data issues
- Basic technical SEO configuration
These checks are valuable, but users should understand what the score does not measure.
A Lighthouse-style SEO score does not determine:
- Whether a keyword has meaningful search volume
- Whether content satisfies search intent
- Whether a site has topical authority
- Whether backlinks are strong
- Whether competitors have better content
- Whether Google has indexed the correct pages
- Whether internal links distribute authority effectively
- Whether a page deserves to rank for a competitive query
A website can therefore score extremely well technically and still receive almost no organic search traffic.
The SEO score is best interpreted as a technical hygiene indicator, not a ranking prediction.
Accessibility Analysis
Automated accessibility testing can uncover many common implementation problems.
Examples include:
- Missing form labels
- Invalid ARIA attributes
- Missing accessible names
- Poor contrast
- Incorrect language settings
- Certain semantic HTML problems
- Images without alternative text
These automated checks are useful because they can discover repeatable technical failures quickly.
However, no automated accessibility score should be treated as complete proof of accessibility or WCAG compliance.
Automated testing cannot fully determine whether:
- Keyboard navigation is intuitive
- Focus order makes sense
- Screen-reader announcements are useful
- Alternative text accurately communicates meaning
- Error messages are understandable
- Dialogs behave correctly
- Complex widgets are usable
- Cognitive accessibility needs are addressed
For important websites, automated auditing should be combined with manual keyboard and assistive-technology testing.
Best Practices
The Best Practices category functions as a broader technical health check.
It can identify selected browser, implementation, security, and web-platform issues.
However, it should not be confused with a complete:
- Security penetration test
- Privacy audit
- Dependency vulnerability scan
- Compliance review
- Application-security assessment
A high Best Practices score means the page passed a particular collection of automated checks. It does not prove that the website is secure.
How to Read a RateMySite Score Correctly
The biggest mistake is treating the final grade as the final answer.
A better process is:
1. Start with the overall grade
Use the grade as a triage signal.
A weak grade indicates that deeper investigation is worthwhile, but it does not tell you exactly what to change.
2. Inspect individual categories
Determine whether the biggest weakness is:
- Performance
- SEO
- Accessibility
- Best Practices
- Another visibility or technical signal
3. Inspect the actual metrics
A Performance score of 60 is less actionable than knowing that:
- LCP is 4.8 seconds
- CLS is 0.35
- TBT is 900 milliseconds
- The hero image is several megabytes
- A third-party script creates long main-thread tasks
The metric explains the problem. The grade only summarizes it.
4. Determine whether the evidence is synthetic or real-world
One synthetic Lighthouse run can fluctuate.
Server response time, network routing, third-party scripts, advertisements, experiments, CPU scheduling, and other conditions can change the result.
For important decisions, compare several runs and validate the change using field data when available.
5. Prioritize user and business impact
Not every warning deserves equal engineering time.
Fixing a broken checkout button is more important than moving a Lighthouse score from 96 to 100.
Likewise, reducing LCP from five seconds to two seconds is usually more meaningful than eliminating a low-impact diagnostic that users never notice.
RateMySite Strengths
Easier technical auditing
RateMySite makes technical performance data easier for non-specialists to interpret.
That is useful when developers, marketers, founders, designers, and clients need to discuss the same website using a common report.
Mobile and desktop comparisons
Desktop-only testing can create false confidence.
A website running on a powerful laptop over a fast connection may feel excellent while performing poorly on a mid-range smartphone.
Comparing mobile and desktop results helps reveal these differences quickly.
Shareable reports
Shareable audit pages are useful for agencies, developers, and website owners who need to communicate problems without sending screenshots of multiple development tools.
Before-and-after benchmarking
A permanent report creates a baseline.
Teams can compare the website before and after:
- A redesign
- Image optimization
- CDN migration
- Framework migration
- JavaScript reduction
- Hosting changes
- SEO fixes
Friendly for small teams
A solo founder may not need a large enterprise observability platform.
RateMySite provides a comparatively low-friction way to identify obvious technical problems before investing in deeper tooling.
RateMySite Limitations
A single grade compresses too much information
Two websites with the same grade can have completely different problems.
One may have excellent performance but weak accessibility. Another may have strong accessibility and SEO but extremely slow JavaScript execution.
The remediation strategy cannot be determined from the overall grade alone.
Synthetic tests have natural variance
Lighthouse measurements can change between runs.
Possible causes include:
- Server load
- Network routing
- CDN behavior
- Third-party services
- Advertisement loading
- A/B testing
- Dynamic content
- Browser scheduling
Important improvements should therefore be compared across multiple consistent tests.
SEO coverage is limited
A Lighthouse-style SEO audit cannot replace tools and datasets designed for search-performance analysis.
Serious SEO work requires additional information about:
- Queries
- Impressions
- Clicks
- Search positions
- Indexation
- Crawl behavior
- Backlinks
- Search volume
- SERP competitors
- Internal linking
- Content gaps
RateMySite is better used as the first layer of technical screening.
Automated accessibility cannot cover everything
Automated accessibility testing is valuable but incomplete.
Critical workflows should still be manually tested.
Public reports may create privacy concerns
Users should assume that a normal public audit URL could potentially be shared or discovered unless RateMySite explicitly marks it as private.
Avoid submitting URLs containing:
- Authentication tokens
- Secret query parameters
- Signed download URLs
- Private staging credentials
- Sensitive internal routes
Visibility metrics need methodological context
Any traffic, ranking, or AI-visibility score is only as useful as its methodology.
When a metric is based on a clearly documented system such as Lighthouse, interpretation is relatively straightforward.
For proprietary aggregated metrics, users should understand the methodology before using the score to make major business decisions.
RateMySite vs PageSpeed Insights vs Lighthouse vs WebPageTest
| Tool | Best for | Main advantage | Main limitation |
|---|---|---|---|
| RateMySite | Fast website health overview | Simple grades, explanations, sharing, benchmarking | Composite grades can hide technical nuance |
| PageSpeed Insights | Google performance diagnostics | Lighthouse plus real-user CrUX data when available | Less focused on simple stakeholder-friendly reporting |
| Chrome Lighthouse | Developer debugging | Detailed auditing directly inside development workflows | Primarily synthetic and more technical |
| WebPageTest | Deep performance investigation | Waterfalls, locations, connection profiles, repeat views, scripting, and video | More complicated for beginners |
These tools should not necessarily be treated as competitors.
A strong workflow can use all four:
- RateMySite for initial diagnosis and sharing.
- PageSpeed Insights for Google performance and CrUX context.
- Chrome Lighthouse for local development and debugging.
- WebPageTest for advanced network and rendering investigation.
A Better Workflow for Using RateMySite
Step 1: Audit more than the homepage
A homepage score does not represent an entire website.
Test important templates such as:
- Homepage
- Pricing pages
- Product pages
- Blog articles
- High-traffic SEO landing pages
- Signup pages
- Checkout pages
- Campaign landing pages
A site built with multiple templates may have dramatically different performance characteristics between page types.
Step 2: Record a baseline
Save the important measurements before making changes:
- Overall grade
- Mobile Performance
- Desktop Performance
- SEO
- Accessibility
- Best Practices
- LCP
- CLS
- TBT
- FCP
- Speed Index
- Major diagnostics
Without a baseline, it becomes difficult to know whether an optimization actually worked.
Step 3: Fix the biggest bottleneck first
Do not optimize based on which warning is easiest to remove.
Prioritize the problem most likely to affect users.
Typical examples include:
- Slow LCP: optimize the hero image, improve server response time, preload critical resources, and reduce render-blocking dependencies.
- High TBT: reduce JavaScript, split large bundles, defer non-essential scripts, and break up long main-thread tasks.
- High CLS: reserve dimensions for images, embeds, advertisements, fonts, and dynamically inserted elements.
- Weak SEO: repair crawlability, metadata, canonical configuration, language settings, or technical indexing issues.
- Weak accessibility: improve labels, semantics, accessible names, contrast, focus management, and keyboard support.
Step 4: Run several comparable tests
Do not compare one lucky test result with one unlucky test result.
Run several tests using comparable conditions and look at the overall pattern or median result.
Step 5: Validate with real users
If sufficient traffic exists, use real-user performance data to confirm that synthetic improvements reached actual visitors.
Step 6: Connect performance to business outcomes
Technical metrics should ultimately support a user or business objective.
Monitor changes in:
- Conversion rate
- Signup completion
- Checkout completion
- Organic clicks
- Bounce rate
- Engagement
- Revenue per visitor
- Error rates
The goal is not simply to make a score green. The goal is to create a faster, more accessible, more discoverable, and more useful website.
Technical Fixes That Commonly Improve RateMySite Results
Optimize the LCP image
The primary above-the-fold image should generally be requested early rather than lazy-loaded.
<link rel="preload" as="image" href="/hero.avif" fetchpriority="high">
<img src="/hero.avif" width="1600" height="900" fetchpriority="high" alt="Product dashboard preview">
Use responsive image attributes when appropriate so mobile users do not download unnecessarily large desktop assets.
Lazy-load below-the-fold images
<img src="/case-study.webp" loading="lazy" width="1200" height="800" alt="Case study result">Explicit dimensions can also help prevent layout shifts.
Defer non-critical JavaScript
<script src="/analytics.js" defer></script>More importantly, audit whether every third-party script is necessary.
Common sources of excessive JavaScript include:
- Tag managers
- Heatmaps
- Chat widgets
- Advertising platforms
- A/B testing tools
- Social embeds
- Multiple analytics systems
Cache versioned assets
For hashed static resources, a long-lived caching policy can significantly reduce repeat-download costs.
Cache-Control: public, max-age=31536000, immutableUse preconnect selectively
<link rel="preconnect" href="https://fonts.gstatic.com" crossorigin>Preconnect is most useful for critical third-party origins needed early in the loading process. Adding it to every external domain can reduce its benefit.
Who Should Use RateMySite?
RateMySite is particularly useful for:
- Indie hackers checking a site before launch.
- Small businesses that need understandable technical diagnostics.
- Marketers who need to communicate performance problems to developers.
- Designers who want technical feedback beyond visual appearance.
- Developers looking for a fast external sanity check.
- Agencies producing simple technical audit reports.
- SEO teams conducting an initial technical screening.
It is less suitable as the only solution for:
- Enterprise observability
- Continuous real-user monitoring
- Large-scale SEO crawling
- Complete backlink research
- Professional accessibility certification
- Application security testing
- Complex authenticated workflows
- Advanced conversion research
Common RateMySite Mistakes
Chasing a perfect 100
A perfect Lighthouse-style score is not a business objective.
A website scoring 92 while supporting payments, useful analytics, personalization, and important application functionality may be more valuable than a stripped-down page scoring 100.
Testing only desktop
Mobile devices often have weaker CPUs and slower network connections.
Desktop performance can therefore hide serious mobile problems.
Treating TBT as INP
TBT and INP are related to responsiveness but are not the same measurement.
TBT is primarily a laboratory metric measuring main-thread blocking during page load.
INP is a Core Web Vital that measures responsiveness to real user interactions.
Assuming a high SEO score guarantees rankings
Technical SEO is only one component of organic search performance.
Ranking also depends on factors such as relevance, competition, content quality, links, authority, indexing, and search intent.
Assuming an accessibility score proves compliance
Passing automated accessibility checks does not guarantee that every user can successfully complete important tasks.
Running only one test
Synthetic audits naturally vary. Important decisions should be based on repeated measurements rather than one isolated number.
Is RateMySite Accurate?
RateMySite can provide useful and technically meaningful diagnostics when its results are derived from established Lighthouse and PageSpeed measurements.
The highest confidence should generally be placed in:
- Individual performance metrics
- Category-level technical results
- Specific failed audits
- Repeatable before-and-after improvements
- Real-user performance evidence where available
Less confidence should be placed in interpreting a single composite letter grade as an absolute definition of website quality.
The most useful question is not:
Is this website objectively an A or a B?
A better question is:
Does the audit identify a real user problem, and does fixing that problem measurably improve the experience?
That is a much stronger standard for evaluating any website auditing platform.
FAQ
Is RateMySite free?
RateMySite.io currently presents its standard website auditing workflow as accessible without the complexity of a traditional enterprise auditing platform. Availability, limits, and premium features can change, so users should verify the current product page before relying on a specific pricing model.
Does RateMySite use Google Lighthouse?
Its performance analysis is built around Google Lighthouse and PageSpeed Insights-style website auditing, making many of the underlying performance metrics comparable with established Google tooling.
Does a high RateMySite SEO score mean a website will rank well?
No. The technical SEO score primarily evaluates whether a page passes selected implementation checks. It does not measure the entire competitive search landscape.
Can RateMySite replace Google Search Console?
No.
Search Console provides search-specific information such as queries, impressions, clicks, indexing reports, page discovery, and search-performance trends that a website audit cannot reproduce.
Can RateMySite replace a professional accessibility audit?
No.
It can identify automated accessibility failures, but important workflows still require manual testing.
Is RateMySite better than PageSpeed Insights?
They serve different layers of the workflow.
RateMySite emphasizes understandable grades, reports, benchmarking, and sharing. PageSpeed Insights provides direct access to Google's Lighthouse and real-user CrUX ecosystem.
Developers investigating complicated performance problems may benefit from using both.
Conclusion
RateMySite is most useful when treated as a fast website health dashboard rather than an all-knowing website quality score.
Its combination of performance auditing, simplified grading, mobile-versus-desktop comparisons, SEO and accessibility checks, shareable reports, and competitive benchmarking makes technical website analysis easier to understand.
The strongest workflow is simple:
- Run the audit.
- Save the baseline.
- Inspect the underlying metrics.
- Identify the biggest bottleneck.
- Fix one measurable problem.
- Run several comparable tests.
- Validate the improvement using real-user and business data.
For answering What is technically holding this page back?, RateMySite can be a useful starting point.
For questions such as why organic traffic is declining, why users are not converting, whether a site is fully accessible, or whether an application is secure, it should remain one layer in a broader diagnostic toolkit.
Use the grade to find the problem, but use the underlying data to decide what to fix.
Continue Reading
More articles connected to the same themes, protocols, and tools.



Referenced Tools
Browse entries that are adjacent to the topics covered in this article.