
On This Page8 sections
Key Takeaways
- The Codex TRACE log issue is real, but the severity depends on actual write behavior, not only on scary headline numbers.
- In one upgraded environment, TRACE logs still accounted for 50,818 of 74,357 rows, about 68.34%.
- During an 80-second sample,
MAX(id)increased by 150, about 1.875 inserts per second. - The SQLite database stayed around 178 MB, and the WAL file stayed around 13 MB during sampling.
- This suggests noisy logging is still present, but this specific sample did not show catastrophic WAL growth or 5 MiB/s continuous writes.
- The safest response is: verify version, run read-only checks, compare active vs idle behavior, monitor WAL growth, then decide whether mitigation is needed.
What Happened
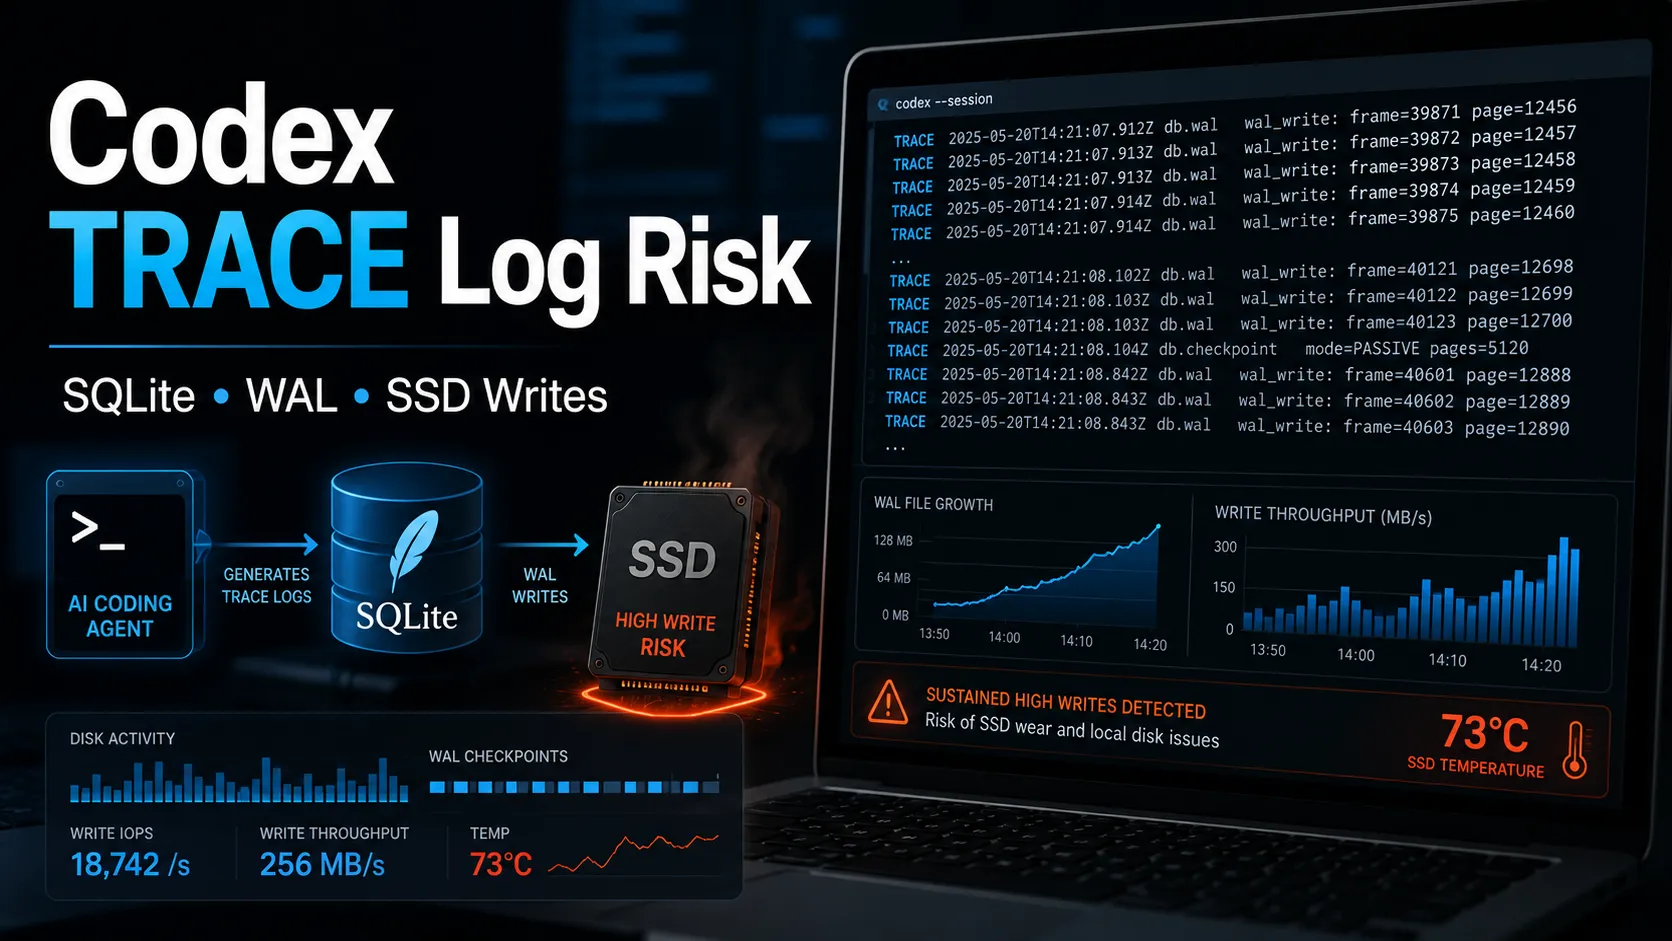
A Codex disk-write issue has been circulating in the developer community. The claim is that Codex can write excessive TRACE logs into:
~/.codex/logs_2.sqliteThe original concern came from reports that, during streaming responses or long-running automation tasks, Codex could write heavily to its local SQLite log database. Some reports mentioned write rates around 5 MiB/s and an extrapolated 640 TB/year of SSD writes under high-intensity usage.
Those numbers are useful as a warning, but they should not be treated as the default outcome for every Codex user.
A more accurate summary is:
Codex can still generate a high volume of TRACE-level diagnostic logs in some environments. Whether that becomes a real SSD risk depends on WAL growth, active write rate, idle behavior, and total system disk I/O.
Real Check After Upgrade
A read-only check after upgrading showed the following log distribution:
TRACE|50818
INFO|17994
DEBUG|4109
WARN|1358
ERROR|78
Total retained rows:
74,357TRACE ratio:
50,818 / 74,357 ≈ 68.34%That is still high. TRACE is a very verbose log level and usually should not dominate retained user-side logs.
However, log ratio alone does not prove active SSD damage. The next check is whether the database and WAL are still growing quickly.
Active Sampling Result
A short read-only sampling window produced this result:
2026-06-23 11:52:39  MAX(id)=79678019  COUNT=74357
2026-06-23 11:52:59  MAX(id)=79678075  COUNT=74357
2026-06-23 11:53:19  MAX(id)=79678106  COUNT=74357
2026-06-23 11:53:39  MAX(id)=79678137  COUNT=74357
2026-06-23 11:53:59  MAX(id)=79678169  COUNT=74357
Across 80 seconds:
79678169 - 79678019 = 150 inserts
150 / 80 ≈ 1.875 inserts per second
File sizes stayed stable:
logs_2.sqlite     ≈ 178 MB
logs_2.sqlite-wal ≈ 13 MB
This is the most important part of the diagnosis.
The data shows that logs were still being inserted, but the database row count stayed fixed and the WAL file did not expand during this sample.
That suggests Codex may be inserting new logs while pruning old ones. It also suggests that this specific sample was not reproducing the worst-case reports of continuous multi-MiB-per-second WAL growth.
Practical Severity: Medium, Not Emergency
Based on the data, the situation is best classified as:
Medium risk / observation required.
What is confirmed:
- TRACE logs are still a large majority of retained logs.
MAX(id)is still increasing.- Codex is still writing into the log database.
- The log profile is noisier than expected for normal user-side diagnostics.
What is not confirmed in this sample:
- WAL is not rapidly growing.
- The database is not expanding without limit.
- The observed write rate is not close to the reported 5 MiB/s scenario.
- There is no direct evidence from this sample that the SSD is currently under extreme write stress.
So the factual conclusion is:
The upgraded Codex environment still shows noisy TRACE logging, but the latest sample does not show a disk-write emergency.
Community Reports Add Context
Other community checks show similar TRACE-heavy distributions. One public VPS example showed:
TRACE|4330
INFO|628
DEBUG|412
WARN|3
ERROR|1
TRACE accounted for roughly 80% of retained rows in that case.
Another user reported much larger counts:
TRACE|371175
DEBUG|65186
INFO|27390
WARN|2326
ERROR|126
These reports are consistent with the same pattern: TRACE logs can dominate the local Codex log database.
But community examples also vary. A light Windows user reported only around 9,000 rows. That matters because the issue appears workload-dependent. Heavy streaming, long-running tasks, automation, and active sessions are more likely to expose it.
How to Check Safely
Use read-only checks first.
sqlite3 -readonly ~/.codex/logs_2.sqlite \
"SELECT level, COUNT(*) FROM logs GROUP BY level ORDER BY COUNT(*) DESC;"
Then check whether writes are still happening:
DB="$HOME/.codex/logs_2.sqlite"
WAL="$DB-wal"

for i in 1 2 3 4 5; do
  date "+%F %T"
  sqlite3 -readonly "$DB" "SELECT MAX(id), COUNT(*) FROM logs;"
  ls -lh "$DB" "$WAL" 2>/dev/null
  sleep 20
done
The key indicators are:
- TRACE percentage: high TRACE ratio means noisy logging.
- MAX(id) growth: shows new inserts.
- COUNT stability: stable count with rising
MAX(id)suggests insert-and-prune behavior. - WAL size: this is the important disk-risk signal.
- Idle behavior: if Codex is fully idle and
MAX(id)still rises quickly, risk is higher.
When It Becomes Serious
The situation becomes more serious if several of these happen together:
logs_2.sqlite-walgrows from MB to hundreds of MB or GB.MAX(id)rises quickly even when Codex is idle.- The system shows sustained disk writes.
- Codex, the IDE, or the machine becomes noticeably slow.
- WAL growth returns after cleanup.
- Multiple Codex sessions or automation tasks are running for long periods.
If the WAL file stays stable and growth only happens during active responses, the issue is still worth tracking, but it is not the same as an immediate SSD failure risk.
Should You Use a SQLite Trigger?
A commonly shared workaround is to block log inserts with a SQLite trigger:
CREATE TRIGGER IF NOT EXISTS block_log_inserts
BEFORE INSERT ON logs
BEGIN
  SELECT RAISE(IGNORE);
END;
This can stop writes, but it is not the first choice.
It directly changes Codex’s internal SQLite database behavior. That may interfere with diagnostics, future migrations, or support debugging.
A less aggressive version is to block only TRACE logs:
CREATE TRIGGER IF NOT EXISTS block_trace_logs
BEFORE INSERT ON logs
WHEN NEW.level = 'TRACE'
BEGIN
  SELECT RAISE(IGNORE);
END;
This is more reasonable than blocking all logs, but it is still a local workaround, not a real upstream fix.
Use this only if the issue is clearly active and harmful, such as when WAL keeps growing or system disk writes become abnormal.
What About Moving Logs to tmpfs?
Another workaround is moving or linking the log database to memory-backed storage.
This can reduce SSD writes if the target is truly memory-backed. But it has caveats:
/tmpis not always tmpfs.- macOS behavior may differ from Linux.
- Memory pressure can still cause swap writes.
- SQLite also uses
-waland-shmfiles. - Moving files while Codex is running can cause lock or consistency problems.
So tmpfs can be a temporary mitigation, but it should not be described as guaranteed SSD-safe.
Recommended Response
For most users, the practical order should be:
- Upgrade Codex and confirm the actual running version.
- Run the read-only log distribution check.
- Sample
MAX(id)and WAL size for 1–2 minutes. - Repeat the sample with Codex idle or fully closed.
- If WAL is stable, keep observing.
- If WAL grows quickly, quit Codex, back up the database files, then consider cleanup.
- Only use triggers or tmpfs-style workarounds when there is clear ongoing write pressure.
To confirm the running version:
codex --version
which codex
This matters because CLI, IDE plugins, desktop builds, stable releases, and alpha builds may not update at the same time.
Conclusion
The current evidence supports a balanced conclusion:
Codex still appears capable of producing a high proportion of TRACE logs after upgrade. In the measured case, TRACE made up about 68.34% of retained logs, and MAX(id) continued to rise. However, the database size stayed around 178 MB, the WAL file stayed around 13 MB, and the measured insert rate was about 1.875 rows per second. That is noisy, but not catastrophic in this sample.
The practical advice is simple:
- Keep Codex updated.
- Run a quick read-only check after upgrading.
- Watch WAL growth, not just TRACE count.
- Do not rush into trigger-based blocking unless there is clear ongoing disk pressure.
- Treat AI coding tools as local developer infrastructure, not as disposable editor plugins.
The issue is real. The panic version is not always accurate. The right response is measurement first, mitigation second.
Continue Reading
More articles connected to the same themes, protocols, and tools.



Referenced Tools
Browse entries that are adjacent to the topics covered in this article.