
On This Page8 sections
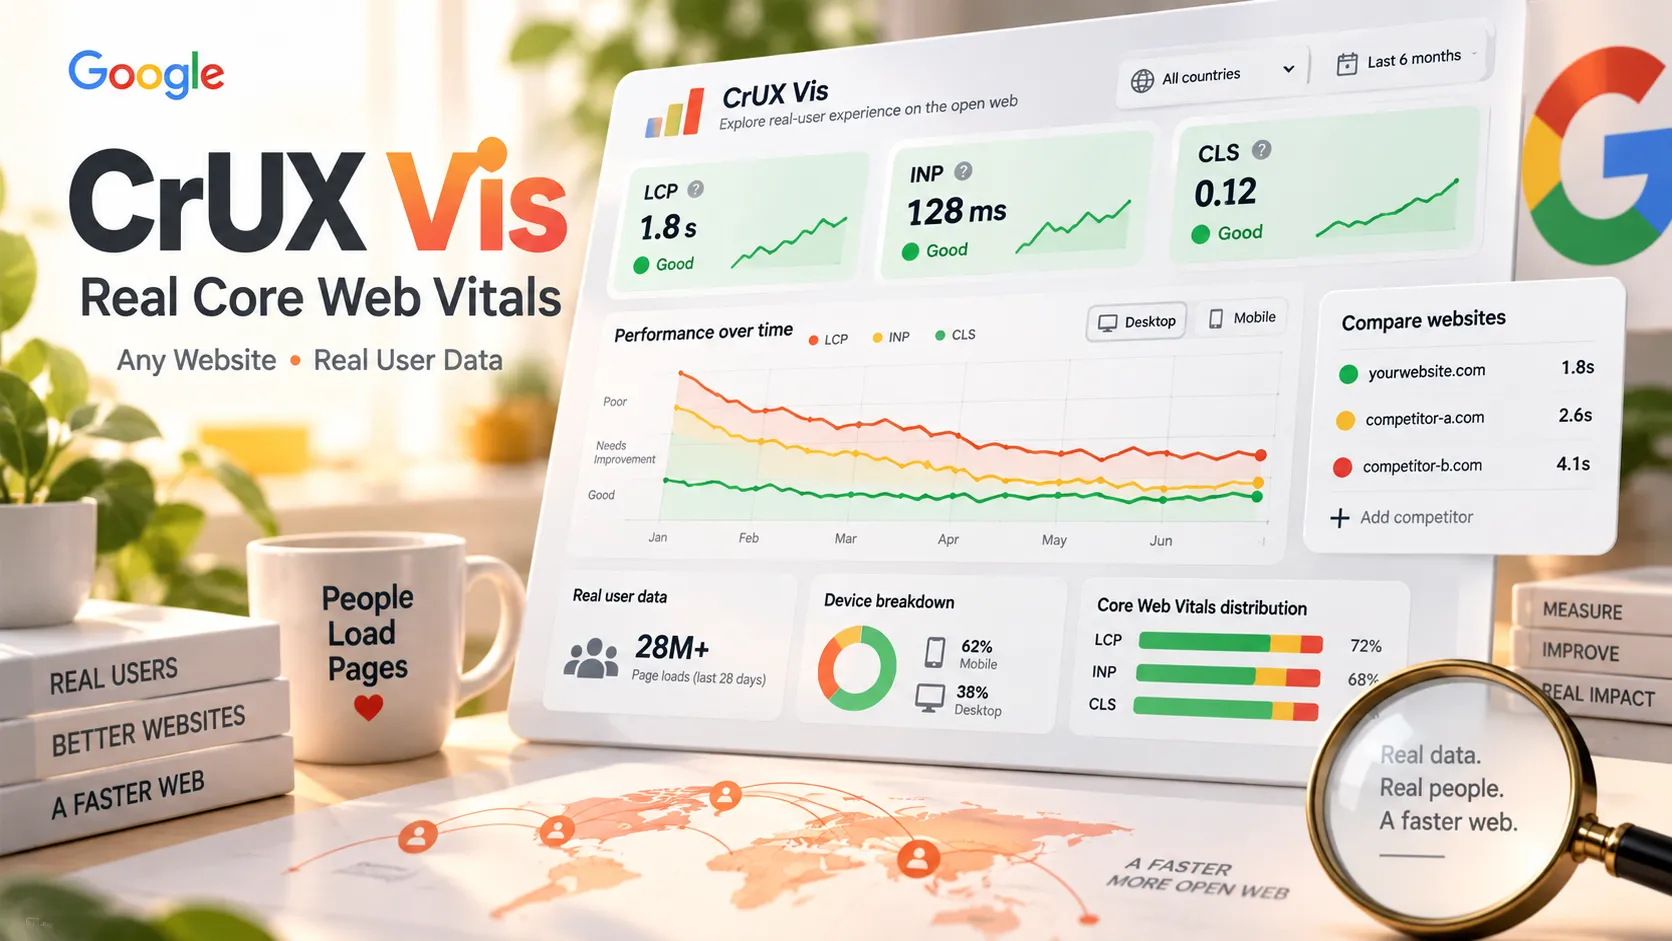
Google offers a free website performance dashboard that lets anyone investigate how real Chrome users experience a website, including competing websites they do not own.
Called CrUX Vis, the tool visualizes historical performance data from the Chrome User Experience Report (CrUX). Unlike conventional speed tests, it uses aggregated measurements from actual browser sessions rather than relying exclusively on simulated page loads.
Available at cruxvis.withgoogle.com, the dashboard provides up to 40 weeks of historical Core Web Vitals data, device-specific performance trends, and experimental advertising experience metrics introduced in September 2026.
For developers, SEO professionals, website publishers, and performance engineers, CrUX Vis offers an unusually transparent view of how websites perform in the real world.
There is one important limitation: not every website has enough eligible traffic to appear in the CrUX dataset. The dashboard is publicly accessible, but its coverage is not universal.
Key Takeaways
- CrUX Vis is a free Google Chrome performance dashboard powered by the Chrome User Experience Report.
- No website ownership verification is required. Anyone can investigate publicly available performance data for competitors.
- The measurements come from real Chrome users, subject to Google's data collection and eligibility requirements.
- Historical trends cover up to 40 weeks, using weekly snapshots of overlapping 28-day collection periods.
- Core Web Vitals include LCP, INP, and CLS, representing loading performance, responsiveness, and visual stability.
- New advertising metrics launched on September 15, 2026, measuring visible ad count, ad density, advertising CPU usage, and network consumption.
- Not all websites or individual pages have data, particularly when eligible traffic is insufficient.
- CrUX Vis is not a traffic estimation service. It cannot reveal visitor counts, organic search traffic, advertising revenue, or conversion rates.
- Developers can access the underlying data through Google's CrUX History API to build automated website monitoring systems.
What Is Google CrUX Vis?
CrUX Vis is Google's visualization interface for the Chrome User Experience Report History API.
The Chrome User Experience Report is a public dataset built from performance measurements collected by eligible Chrome browsers during real visits to websites.
CrUX Vis converts this information into historical charts, allowing users to examine how website performance changes over time.
Google introduced CrUX Vis in October 2024 as an experimental visualization tool. It was designed to make historical CrUX data accessible without requiring developers to build dashboards or integrate APIs.
The official CrUX Vis documentation describes the dashboard as a visualization of weekly historical data from the CrUX History API.
The distinction matters because most website speed tests answer a different question.
A synthetic test asks how quickly a page loads under a particular simulated environment. CrUX Vis asks how a website actually performed across many eligible real-user experiences over time.
Why Real-User Data Matters
Website performance can differ dramatically between a developer's computer and a visitor's device.
Real users encounter different conditions:
- Entry-level and high-end smartphones.
- Fast broadband and congested mobile networks.
- Different CPU capabilities and memory constraints.
- Varying browser cache conditions.
- Advertising scripts and third-party integrations.
- Different geographic distances from hosting infrastructure.
- Background tasks and device resource contention.
A site that scores well in a local Lighthouse audit can still deliver a disappointing experience to a substantial portion of its visitors.
CrUX helps expose that difference by measuring aggregated field performance rather than treating one laboratory run as representative of every user.
How to Use CrUX Vis to Check a Website
Using the dashboard requires no installation, account connection, or website verification.
Step 1: Open the Official Dashboard
Visit Google CrUX Vis.
Enter the website address into the search field.
For example:
https://example.com
Press Enter or use the dashboard's Go control.
The dashboard will attempt to retrieve publicly available historical data for the specified website.
Step 2: Choose Origin or URL Data
CrUX Vis supports two important levels of analysis.
Origin-level data aggregates eligible experiences across an entire origin.
For example:
https://example.com
This can include eligible visits across multiple pages belonging to that origin.
URL-level data measures a specific page when sufficient eligible information exists.
For example:
https://example.com/blog/article
This distinction is especially important for content websites, e-commerce stores, and browser-game directories.
A lightweight homepage can perform well while individual game pages containing embedded content and advertising scripts perform poorly.
Origin-level measurements may hide these differences because they combine experiences across eligible pages.
Important: https://example.com, https://www.example.com, and https://app.example.com are different origins. Google does not automatically merge these addresses into one result.
Step 3: Select the Device Category
The dashboard supports four device views:
- Phone.
- Desktop.
- Tablet.
- All data.
For many consumer websites, mobile performance deserves particular attention because mobile devices frequently have less processing power and more variable network conditions.
However, the correct priority depends on the website's actual audience.
A developer tool used mainly on desktop computers may have a very different device distribution from a mobile-first game.
Comparing competitors requires consistent device filters. A competitor's desktop performance should not be compared directly against another website's mobile performance.
Step 4: Select the Historical Period
CrUX Vis can display up to 40 weekly historical observations, where data is available.
The available controls allow users to adjust the historical range and display measurements as 75th-percentile values, distributions, or both.
These views help distinguish isolated changes from sustained performance improvements.
Step 5: Investigate Individual Metrics
Start with the Core Web Vitals overview.
Identify which metrics are outside Google's recommended thresholds, then open the corresponding detailed section.
For instance, if loading performance is deteriorating, examine LCP alongside TTFB and other loading-related measurements.
If responsiveness is the main problem, focus on INP and investigate potential JavaScript execution bottlenecks using local debugging tools.
Understanding the Three Core Web Vitals
Google's Core Web Vitals framework focuses on three user-experience dimensions.
| Metric | What It Measures | Good | Needs Improvement | Poor |
|---|---|---|---|---|
| LCP | Largest Contentful Paint | ≤ 2.5 seconds | > 2.5 to 4 seconds | > 4 seconds |
| INP | Interaction to Next Paint | ≤ 200 ms | > 200 to 500 ms | > 500 ms |
| CLS | Cumulative Layout Shift | ≤ 0.1 | > 0.1 to 0.25 | > 0.25 |
These thresholds are documented in Google's Core Web Vitals guidance.
Largest Contentful Paint: Loading Performance
LCP measures when the largest relevant content element becomes visible within the viewport.
Depending on the page, that element might be a hero image, prominent heading, or large content block.
A high LCP can result from:
- Slow server responses.
- Large, poorly optimized images.
- Render-blocking CSS or JavaScript.
- Delayed discovery of important resources.
- Client-side rendering dependencies.
- Heavy third-party scripts.
For example, a content website that loads its largest image through JavaScript after application hydration may produce a slower LCP than an equivalent page that exposes the image directly in its initial HTML.
Potential improvements include serving appropriately sized AVIF or WebP images, prioritizing the LCP resource, reducing render-blocking dependencies, and improving server response times.
Interaction to Next Paint: Responsiveness
INP measures how quickly a page responds visually to user interactions during a visit.
It replaced First Input Delay as a Core Web Vital in March 2024.
A poor INP score often indicates that user interactions are being delayed by JavaScript execution, expensive rendering, or other main-thread activity.
Typical causes include:
- Long-running JavaScript tasks.
- Expensive React component updates.
- Synchronous data processing.
- Large event handlers.
- Excessive third-party JavaScript.
- Complex DOM updates and layout calculations.
For browser games and interactive tools, INP is particularly important because users expect immediate responses to clicks, selections, and other controls.
Common optimization techniques include splitting long tasks, reducing unnecessary rendering, deferring nonessential scripts, and moving suitable computation into Web Workers.
Cumulative Layout Shift: Visual Stability
CLS measures unexpected visual movement during a page visit.
A high CLS value can indicate that interface elements move after users begin interacting with the page.
Frequent causes include:
- Images without reserved dimensions.
- Ads inserted into the document without predefined space.
- Dynamically loaded banners.
- Font changes that alter text layout.
- Embedded content that expands after loading.
Advertising-supported websites should pay particular attention to this metric.
Allocating stable dimensions for ad containers and embedded elements can prevent large amounts of unexpected movement.
What Does the 75th Percentile Mean?
CrUX Vis reports performance using the 75th percentile, commonly abbreviated as P75.
This is not the average result.
Suppose a website reports an LCP P75 of 2.3 seconds.
That means approximately 75% of eligible measured experiences had an LCP of 2.3 seconds or less, while the remaining 25% experienced slower values.
A P75 result provides a more representative measure of broadly experienced performance than a single best-case test.
Google uses the 75th percentile because it captures the experience of most visitors without allowing a small number of extreme outliers to dominate the measurement.
Why the Distribution Chart Also Matters
Two websites can have similar P75 values but different underlying performance distributions.
Consider an illustrative comparison:
| Metric | Website A | Website B |
|---|---|---|
| LCP P75 | 2.4 seconds | 2.4 seconds |
| Good LCP experiences | 76% | 75% |
| Poor LCP experiences | 4% | 12% |
Both sites meet the recommended LCP threshold at P75.
However, Website B has a substantially larger proportion of very slow experiences.
This demonstrates why performance distributions can reveal information that a single percentile does not.
The example is hypothetical and does not represent measurements from actual websites.
The Six Sections of CrUX Vis Explained
As of October 2026, the dashboard contains six primary sections.
1. Core Web Vitals
Provides a consolidated historical view of LCP, INP, and CLS.
This is the best starting point for identifying whether a website generally meets Google's recommended performance standards.
2. Loading Performance
Provides deeper visibility into loading-related measurements, including:
- Largest Contentful Paint.
- First Contentful Paint.
- Time to First Byte.
- LCP resource type.
- LCP image loading subparts.
- Round Trip Time.
- Navigation types.
These metrics can help distinguish server delays from frontend rendering problems.
For example, deteriorating TTFB alongside LCP may indicate that server or network delays are contributing to slower loading.
By contrast, stable TTFB combined with deteriorating LCP may point toward client-side resource loading or rendering issues.
These relationships are diagnostic clues rather than proof of causation.
3. Interactivity
Focuses primarily on Interaction to Next Paint.
This section is useful for detecting changes in responsiveness after deploying new JavaScript bundles, interactive components, analytics integrations, or third-party scripts.
4. Visual Stability
Tracks Cumulative Layout Shift.
This is especially useful after introducing advertisements, banners, dynamic widgets, or new page templates.
5. Ad Metrics
Introduced in September 2026, this section provides experimental measurements of advertising experiences.
It includes Ad Count, Ad Density, Ad Weight: CPU, and Ad Weight: Network.
6. All Metrics
Combines available performance and advertising metrics into one view.
This is useful when investigating changes that affect multiple performance dimensions simultaneously.
New in 2026: Google CrUX Advertising Metrics
One of the most significant recent developments is the introduction of advertising experience measurements.
On September 15, 2026, Google Chrome announced new CrUX ad metrics.
These measurements extend CrUX beyond traditional loading, responsiveness, and visual stability indicators.
They allow developers, publishers, and advertisers to understand how heavily advertising affects real browsing sessions.
The Four Advertising Metrics
| Metric | Definition | Practical Application |
|---|---|---|
| Ad Count | Average number of visible ad frames in the viewport during a session | Understand how many ads users typically see at once |
| Ad Density | Average percentage of visible viewport area occupied by ads | Evaluate advertising layout density |
| Ad Weight: CPU | Cumulative advertising-related CPU execution time | Identify computationally expensive advertisements |
| Ad Weight: Network | Cumulative network resources transferred by ads | Evaluate bandwidth overhead from advertisements |
The API metric identifiers are:
experimental_ad_countexperimental_ad_densityexperimental_ad_cpuexperimental_ad_kilobytes
These metrics are experimental and are not part of Core Web Vitals.
Google has not defined official Good, Needs Improvement, or Poor thresholds for them.
How Ad Density Is Calculated
Ad Density represents the share of the visible viewport occupied by advertising throughout a browsing session.
Chrome samples the viewport approximately once per second while collecting the relevant measurements.
The calculation considers advertising areas visible at each sampled moment.
For example, an Ad Density P75 of 23% means that approximately 75% of eligible sessions experienced a session-average ad density of 23% or less.
It does not mean that every page has advertisements covering exactly 23% of its total document area.
The distinction is important for websites with sticky ads, long articles, infinite scrolling, or advertisements inserted between content blocks.
Overlapping ad areas are counted once when calculating their combined occupied viewport area.
Why Advertising Metrics Matter
Traditional website analytics reveal impressions, click-through rates, and advertising revenue.
They do not necessarily reveal how intrusive advertisements appear to users or how much browser processing they consume.
CrUX ad metrics offer an additional perspective.
Publishers can investigate whether increasing advertising intensity coincides with deteriorating user experience.
For example, a website owner could compare three measurements after a layout change:
- Ad Density increases.
- INP becomes slower.
- CLS worsens.
That pattern would justify investigating the advertising implementation.
However, it would not establish that advertisements caused every performance regression. Other website changes and shifts in visitor composition could also explain the trend.
Why Some Websites Have No Advertising Metrics
Google applies additional eligibility requirements to advertising measurements.
According to its ad measurement methodology, sites must include at least one authorized advertising seller in their ads.txt file to qualify for aggregated CrUX ad reporting.
A missing file or one containing only placeholder records can prevent the advertising metrics from appearing.
The website must also meet the normal CrUX eligibility requirements.
Because these metrics launched in September 2026, their available history may be shorter than the maximum 40-week window supported by the broader dashboard.
How CrUX Vis Historical Data Works
CrUX Vis offers up to 40 weeks of historical measurements, but those data points require careful interpretation.
Each weekly observation summarizes a rolling 28-day collection period.
The CrUX History API normally updates on Mondays, using measurements ending on the preceding Saturday.
For example, adjacent weekly observations contain substantial overlapping data.
This creates a smoother historical trend and reduces sensitivity to short-lived anomalies.
It also introduces a delay between deploying a performance improvement and seeing its full impact in the historical dataset.
Why Performance Improvements Can Appear Gradually
Suppose a website deploys a major image optimization on October 1.
A weekly observation released shortly afterward still contains many visits from before the optimization.
As subsequent weeks pass, the previous slower experiences gradually leave the 28-day collection window.
Consequently, improvements may become more visible over several weekly updates.
This leads to two important analytical rules:
- Do not interpret adjacent weekly points as completely independent measurements.
- Do not assume that an optimization failed simply because the first subsequent historical observation changed only slightly.
The rolling window also means that a sudden traffic composition change can affect performance trends even when the website's code remains unchanged.
Can CrUX Vis Really Check Every Website?
CrUX Vis can query publicly available CrUX measurements without ownership verification, but coverage is restricted to eligible websites and pages.
Google's documentation states that the dataset includes more than 15 million origins.
However, many smaller websites do not have enough eligible observations to appear.
Which Users Contribute to CrUX?
CrUX data comes from eligible Chrome users who satisfy Google's collection requirements.
These include browser usage-statistics settings, browser history synchronization requirements, and supported platforms.
| Browser or Platform | Included in CrUX? |
|---|---|
| Chrome on Windows | Eligible users only |
| Chrome on macOS | Eligible users only |
| Chrome on Android | Eligible users only |
| Chrome on ChromeOS | Eligible users only |
| Chrome on Linux | Eligible users only |
| Chrome on iOS | No |
| Safari | No |
| Firefox | No |
| Microsoft Edge | No |
| Android WebView | No |
The dataset is therefore not a complete census of all website visitors.
A website whose audience primarily uses Safari, in-app browsers, or other unsupported environments may have real traffic that is not represented in CrUX.
Why a Website Might Show No Data
Common reasons include:
- Insufficient eligible Chrome traffic.
- The queried page does not meet public discoverability requirements.
- A
noindexdirective or unsuccessful HTTP response prevents eligibility. - The wrong protocol or subdomain was entered.
- URL-level data is unavailable even though origin-level data exists.
- The requested device category has insufficient eligible observations.
- A recently launched website has not accumulated sufficient data.
Google does not publish a precise minimum visitor threshold for CrUX inclusion.
Therefore, a missing result cannot be converted into a reliable traffic estimate.
No CrUX data does not mean zero website traffic.
How to Troubleshoot Missing Results
A practical troubleshooting sequence is:
- Confirm the actual destination after redirects.
- Check the correct
httpsorhttpprotocol. - Verify whether the website uses
wwwor another subdomain. - Try origin-level data instead of a specific URL.
- Switch from Phone to All Data.
- Check whether the page can be indexed and returns a successful response.
- Recognize that insufficient qualifying traffic may still prevent inclusion.
Google's CrUX methodology documentation explains these eligibility rules in detail.
CrUX Vis vs PageSpeed Insights vs Lighthouse
Although these tools overlap, they serve different purposes.
| Tool | Main Purpose | Real-User Data | Historical Trends | Competitor Analysis |
|---|---|---|---|---|
| CrUX Vis | Historical field-performance monitoring | Yes | Up to 40 weeks | Yes |
| PageSpeed Insights | Performance assessment and optimization guidance | Yes, when available | Primarily current snapshots | Yes |
| Lighthouse | Synthetic performance audits | Primarily lab measurements | Only if results are stored separately | Yes |
| Google Search Console | Search visibility and website experience reporting | Uses CrUX field data for CWV reporting | Yes | Requires property access |
| CrUX History API | Programmatic historical performance data | Yes | Up to 40 weeks | Yes |
When to Use PageSpeed Insights
PageSpeed Insights is useful when investigating a specific URL and identifying potential improvements.
It combines available CrUX field data with Lighthouse-based laboratory diagnostics.
When to Use Lighthouse
Lighthouse is useful during development and debugging.
It provides actionable diagnostics about resource loading, rendering, accessibility, and other technical issues under a controlled testing environment.
Its simulated performance score should not be treated as equivalent to the real-user Core Web Vitals assessment.
When to Use Google Search Console
Google Search Console is particularly valuable for website owners because it groups URLs by Core Web Vitals status and helps identify affected page groups.
However, access depends on having permission for the relevant website property.
CrUX Vis removes that ownership barrier for publicly available CrUX metrics.
The Most Effective Combination
An efficient workflow uses the tools together:
- Use CrUX Vis to identify historical changes.
- Use Search Console to prioritize affected pages on owned websites.
- Use PageSpeed Insights to obtain page-specific diagnostic information.
- Use Lighthouse and browser DevTools to investigate the underlying implementation.
- Return to CrUX Vis to observe whether improvements eventually appear in real-user data.
How to Analyze Competitor Website Performance
CrUX Vis creates opportunities for technical competitive research without requiring proprietary analytics access.
Example: Comparing Two Content Websites
Imagine two competing websites with similar audiences.
Their hypothetical mobile metrics are:
| Metric | Site A | Site B |
|---|---|---|
| LCP P75 | 2.1 seconds | 3.8 seconds |
| INP P75 | 145 ms | 320 ms |
| CLS P75 | 0.05 | 0.18 |
Site A meets all three recommended thresholds, while Site B requires improvements across several dimensions.
This does not prove Site A has better SEO rankings or higher conversion rates.
It does indicate that Site A provides a better experience according to the measured performance criteria.
A competitor investigation could then examine image delivery, HTML structure, caching behavior, JavaScript bundles, advertising integrations, and third-party resources.
Five Rules for Accurate Competitor Comparisons
1. Match device categories. Compare Phone against Phone rather than mixing device types.
2. Match collection periods. Different time ranges can produce misleading results.
3. Compare the same aggregation level. An origin-wide result is not directly equivalent to a single-page result.
4. Consider page and audience differences. A media-heavy application and a minimal text page naturally have different performance characteristics.
5. Separate correlation from causation. A historical improvement does not identify the exact optimization responsible.
CrUX Vis is a measurement tool, not an explanation engine.
What CrUX Vis Means for Google SEO
Core Web Vitals are relevant to Google's ranking systems, but their role is frequently overstated.
Google's page experience documentation explains that Core Web Vitals are used by ranking systems while emphasizing that good performance scores do not guarantee high rankings.
Search relevance, content quality, usefulness, and other ranking considerations remain important.
Consequently, the following conclusions are incorrect:
- A website with excellent Core Web Vitals must rank above slower competitors.
- A website with poor performance cannot receive significant organic traffic.
- A missing CrUX result means a website has no search visibility.
- Improving Lighthouse scores automatically produces an SEO traffic increase.
The strongest SEO argument for performance optimization is broader than ranking signals alone.
A faster, more responsive, and more stable website can improve usability and reduce friction during important interactions.
These benefits matter even when their direct impact on search rankings cannot be isolated.
For independent publishers, performance improvements should complement content development, search intent alignment, internal linking, and other foundational SEO practices.
Advanced Limitations: SPAs, Query Parameters, and Iframes
Several technical details can influence how CrUX data should be interpreted.
Single-Page Applications
Client-side navigation in React, Vue, and other SPA architectures can make page-level measurement more complicated.
A route transition may appear to the user as a new page but remain part of the original browser document lifecycle.
As a result, some experience measurements can be attributed to the initial page rather than the virtual route that appears afterward.
Developers building extensive client-rendered applications should supplement CrUX with application-level real-user monitoring.
Query Parameters and URL Fragments
CrUX strips query strings and fragments when aggregating URL-level experiences.
For instance, parameterized variants of a page may contribute to the same reported URL.
This is useful for grouping tracking parameters, but it can be misleading if query parameters represent fundamentally different content.
Embedded Iframes
CrUX primarily reports experiences at the top-level page.
Embedded iframe content is not independently reported simply because it appears inside another page.
However, iframe activity can contribute to the performance measurements of the containing page.
For browser-game portals and websites embedding third-party applications, this distinction is particularly important.
Aggregated Data Cannot Explain Individual Sessions
CrUX Vis does not reveal:
- Individual visitor identities.
- Exact session replay information.
- Raw visitor counts.
- Organic traffic estimates.
- Conversion rates.
- Advertising revenue.
- Individual request waterfalls.
- Every geographic audience segment.
These limitations prevent it from replacing traditional analytics, browser DevTools, and dedicated real-user monitoring systems.
How to Get Historical Data Using the CrUX History API
Developers can retrieve the data underlying CrUX Vis through Google's official CrUX History API.
The API supports automated monitoring of websites and individual URLs.
To use it:
- Create or select a Google Cloud project.
- Enable the Chrome UX Report API.
- Generate an API key and apply appropriate restrictions.
- Query the historical endpoint using an HTTP POST request.
The endpoint is:
https://chromeuxreport.googleapis.com/v1/records:queryHistoryRecord
Example: Request 40 Weeks of Mobile Core Web Vitals
Store the API key in an environment variable, then run the following command in a terminal:
export CRUX_API_KEY='YOUR_API_KEY'
curl -sS -X POST "https://chromeuxreport.googleapis.com/v1/records:queryHistoryRecord?key=${CRUX_API_KEY}" -H 'Content-Type: application/json' -d '{"origin":"https://example.com","formFactor":"PHONE","collectionPeriodCount":40,"metrics":["largest_contentful_paint","interaction_to_next_paint","cumulative_layout_shift"]}'
The request specifies:
origin: The website being analyzed.formFactor: The device category.collectionPeriodCount: The number of historical collection periods requested.metrics: The performance measurements to return.
For individual page data, use the url field instead of origin.
Understanding the API Response
The response contains historical collection periods and metric time series.
Important structures include:
record.collectionPeriods: The date ranges associated with historical observations.record.metrics: The requested metrics.percentilesTimeseries.p75s: Historical 75th-percentile values.histogramTimeseries: Historical performance distributions.
Some measurements may contain missing observations.
For example, an unavailable percentile can appear as null, while an unavailable histogram density can appear as the string NaN.
Applications should handle these values explicitly rather than interpreting them as zero.
Another implementation detail is that some percentile values, including CLS, can be represented as strings and may require numeric conversion before plotting.
Querying Advertising Metrics
The same API can retrieve experimental advertising measurements.
Example request:
curl -sS -X POST "https://chromeuxreport.googleapis.com/v1/records:queryHistoryRecord?key=${CRUX_API_KEY}" -H 'Content-Type: application/json' -d '{"origin":"https://example.com","formFactor":"PHONE","collectionPeriodCount":40,"metrics":["experimental_ad_count","experimental_ad_density","experimental_ad_cpu","experimental_ad_kilobytes"]}'Advertising metrics are returned only when the requested site and relevant observations satisfy the additional reporting requirements.
An absence of advertising measurements should not automatically be interpreted as evidence that the website has no advertising.
API Pricing and Limits
Google documents a shared limit of 150 queries per minute per Google Cloud project for the standard CrUX API and CrUX History API.
These queries are offered without charge under the documented limits.
For a monitoring system tracking 100 origins across two device categories, a weekly collection requires approximately 200 requests, assuming one request per origin and device combination.
That workload is manageable within the published quota if requests are rate-limited appropriately.
The API cannot reveal performance information for origins that fail CrUX eligibility requirements.
Building a Website Performance Monitoring Dashboard
For developers managing multiple websites, the CrUX History API can support a lightweight automated monitoring platform.
A practical architecture could use:
- Cloudflare Workers to retrieve data.
- Cron Triggers to schedule weekly checks.
- Cloudflare D1 to store historical observations.
- React and ECharts to visualize changes.
- Notifications to flag performance regressions.
Suggested Monitoring Fields
Each stored observation should identify the website, device category, metric, collection window, and recorded value.
Useful fields include:
- Origin or URL.
- Device category.
- Collection period start and end dates.
- LCP P75.
- INP P75.
- CLS P75.
- Ad Density P75, when available.
- Ad Count P75, when available.
- Retrieval timestamp.
- API response status.
Historical records should be keyed by origin, device category, and collection period to prevent duplicates when data is fetched repeatedly.
Useful Automated Alerts
A monitoring system could flag:
- LCP crossing the 2.5-second threshold.
- INP crossing the 200-millisecond threshold.
- CLS crossing 0.1.
- Significant deterioration across multiple weekly observations.
- A sudden increase in advertising CPU consumption.
- A website losing previously available CrUX coverage.
Alerts based on small changes should use reasonable tolerances and persistence requirements because rolling historical observations overlap.
For example, requiring a regression to persist across multiple collection periods may reduce false alarms.
Because historical data updates weekly, there is little benefit in repeatedly requesting identical History API observations throughout the same day.
An Important Monitoring Limitation
A custom CrUX dashboard is not a substitute for instant deployment monitoring.
For immediate production regressions, synthetic checks and first-party real-user monitoring are more appropriate.
CrUX history is best used to validate sustained changes in user experience over time.
Common CrUX Vis Mistakes to Avoid
Mistake 1: Treating CrUX as Google Analytics. CrUX reports user-experience metrics, not visitor totals, user acquisition channels, or revenue.
Mistake 2: Comparing different device populations. Phone and desktop performance are influenced by different device capabilities and user behavior.
Mistake 3: Assuming origin data represents every page equally. Origin-level results aggregate eligible experiences and can obscure slower page templates.
Mistake 4: Expecting changes to appear immediately. Historical metrics use overlapping 28-day collection periods.
Mistake 5: Treating missing data as zero traffic. Google does not disclose the exact traffic threshold for CrUX inclusion.
Mistake 6: Assuming correlation proves causation. A performance trend cannot establish which code change produced the result.
Mistake 7: Confusing advertising metrics with SEO ranking signals. The new experimental ad measurements are not part of Core Web Vitals and have no official performance thresholds.
Mistake 8: Ignoring embedded applications. Iframes and third-party content can affect the experience of the top-level page.
Mistake 9: Relying on a single Lighthouse score. Laboratory testing and aggregated real-user measurements serve different diagnostic purposes.
Frequently Asked Questions
Is CrUX Vis an Official Google Tool?
Yes. CrUX Vis is documented and maintained as part of Google's Chrome User Experience Report tooling.
The official dashboard is available at cruxvis.withgoogle.com.
Is CrUX Vis Free?
Yes. The dashboard is publicly accessible without payment. The underlying CrUX APIs also provide free access subject to Google's published quotas.
Can CrUX Vis Analyze Competitor Websites?
Yes. Website ownership verification is not required to view publicly available CrUX measurements.
However, competitors without sufficient eligible traffic or qualifying pages may not have data.
How Far Back Does CrUX Vis Go?
The dashboard supports up to 40 weekly collection periods, representing approximately 10 months of historical observations.
Not every origin, URL, or recently introduced metric will necessarily have a complete history.
How Often Does CrUX Vis Update?
The historical dataset is normally refreshed every Monday. Each observation represents an overlapping 28-day period rather than one isolated day.
Does CrUX Vis Show Actual Website Traffic?
No. It does not disclose visitor counts, pageview totals, organic traffic, or traffic sources.
Tools such as Google Analytics and Search Console provide different information for verified website owners.
Why Does PageSpeed Insights Show Different Results?
PageSpeed Insights combines current CrUX field data with Lighthouse laboratory diagnostics.
CrUX Vis concentrates on historical field trends. Differences in aggregation level, device category, collection period, and the distinction between lab and field data can explain apparent inconsistencies.
Does Passing Core Web Vitals Guarantee Better SEO Rankings?
No. Google uses Core Web Vitals within its ranking systems, but good performance scores do not guarantee strong search rankings.
Relevant, useful content and other ranking considerations remain essential.
Can CrUX Vis Diagnose the Exact JavaScript Causing Poor INP?
No. CrUX Vis identifies patterns and regressions in aggregated user experience.
Chrome DevTools, Lighthouse, and detailed application monitoring are better suited to identifying specific scripts, tasks, and rendering bottlenecks.
Are the New CrUX Advertising Metrics Ranking Factors?
Google describes the advertising measurements introduced in September 2026 as experimental. They are not Core Web Vitals and do not have official Good or Poor thresholds.
The published documentation does not establish them as separate direct ranking factors.
Conclusion
Google CrUX Vis is one of the most useful free tools for understanding website performance from the perspective of real users.
Its strongest advantage is the ability to inspect historical Core Web Vitals for eligible websites without requiring ownership verification or access to private analytics.
The combination of 40-week performance trends, device-level filtering, URL-level investigation, and newly introduced advertising measurements makes it particularly valuable for website developers, SEO specialists, publishers, and competitive researchers.
However, CrUX Vis should be interpreted within its limitations. Its data covers eligible Chrome experiences rather than every visitor, its historical observations are delayed and overlapping, and it cannot explain the underlying cause of every performance change.
For an effective website optimization workflow, use CrUX Vis to detect long-term trends, PageSpeed Insights and Chrome DevTools to investigate technical bottlenecks, and the CrUX History API to automate monitoring across multiple websites.
Start by opening CrUX Vis, entering a website or competitor's domain, selecting Phone, and checking the last 40 weeks of LCP, INP, and CLS. The resulting trends provide a practical starting point for evidence-based website performance improvements.
Continue Reading
More articles connected to the same themes, protocols, and tools.

REA (Reverse Engineer Anything): The Complete Guide to AI-Powered Reverse Engineering in 2026

What Is Qwant? The Complete 2026 Guide to France’s Private Search Engine, AI Answers, and Staan
Cursor vs Windsurf (Devin Desktop) vs Claude Code: The Definitive 2026 AI Coding Tools Showdown
Referenced Tools
Browse entries that are adjacent to the topics covered in this article.