

HyperProbe
Runtime state capture for human and agent-assisted service debugging.
Information checked: Sep 12, 2026 ·View sources
Tool details
- Type
- Developer workflows
- Platforms
- Not verified
- Free plan
- Yes
- Open source
- Not verified
- Bring your own key
- Not verified
- Local models
- Not verified
Overview
Best for
- Teams debugging running backend services
- Coding agents that need runtime evidence
Strengths
- Can obtain runtime values that existing logs did not record.
- Makes the same debugging evidence available through editor and agent workflows.
Limitations & trade-offs
- Projects where adding a service SDK is not possible
- Users needing private hosting on the free tier
- Initial service instrumentation and deployment are required.
- Professional pricing has a three-service minimum; private deployment is an enterprise option.
Get started
Pricing & usage limits
Official pricingFree tier · From $297
One service on managed cloud with unlimited probes and captures.
Minimum three services. $79 per service/month with annual billing; includes 30-day capture history and a shared workspace.
Self-hosting or private VPC, RBAC, approvals, and PII redaction options.
Pricing checked: Sep 12, 2026 · Subscription, usage limits, and model costs may be billed separately.
Features & details
Runtime evidence
- Read-only probes capture variables and stack context
- JavaScript/TypeScript, Java/Kotlin, Python, and Ruby support
- No redeploy for subsequent probes after SDK setup
Developer and agent access
- VS Code extension
- MCP access for tools such as Claude Code, Codex, and Cursor
- Shared capture workflows on team plans
Capture the value that the logs missed
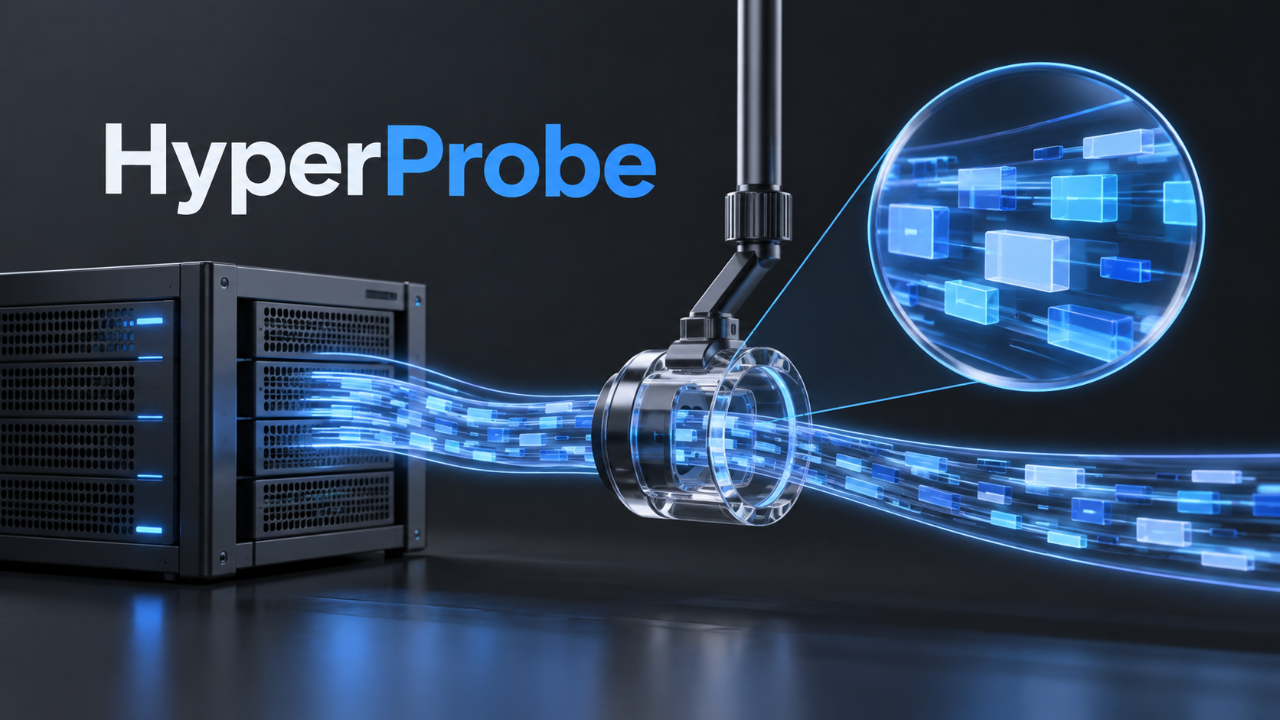
HyperProbe addresses a specific debugging problem: a request took an unexpected branch, but existing logs do not show the value that caused it. A read-only probe can capture state when execution reaches a selected line without stopping the process.
This is most useful after narrowing the investigation to a service and code path. A probe will not return a useful capture if the affected request never reaches its location.
Get your first useful capture
- Follow the quickstart to create a service and install the editor integration and appropriate SDK.
- Initialize the SDK as directed and deploy the instrumented service with source and build metadata that match the running version.
- Place a probe on an executable line near the suspected condition, then exercise that request path.
- Inspect the captured variables and stack, or let your configured MCP client use that evidence to investigate the cause.
Separate setup from subsequent debugging
The no-redeploy workflow applies after instrumentation is in place. For a first trial, use a staging service and a reproducible request, then decide which captured fields are appropriate for your production environment. Free managed-cloud operation and enterprise private deployment have different data boundaries; choose the deployment that matches your requirements.
Model support & data privacy
Privacy & data handling
The free plan uses managed cloud. Captures can contain runtime data; review field handling and retention. Private deployment and PII redaction are listed as enterprise options.
Guides, reviews & fixes
View allNo published guides yet. Start with the official documentation above.
Product updates
No verified product updates listed yet. Follow this tool to see new relevant content in Saved.
See the content timelineSources & verification
Verification dates record when this directory checked the information. Product release dates appear separately above.